
Driver personas: New behaviors & their risk implications


Driver personas: New behavioral clusters and their risk implications
Your Driver Persona – how you behave behind the wheel – has important implications for your insurance premiums.
Personal and commercial auto insurance is broken. The industry has lost money every year since 2011 and burdened new customers with higher premiums to help mitigate older losses. Much of this is due to outdated risk models. While insurers look at demographics like age and neighborhood, these aren’t the only important factors affecting a driver’s risk.
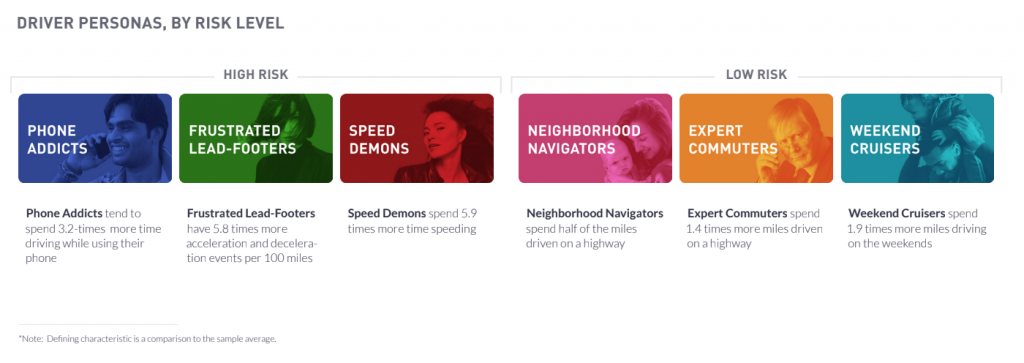
We’ve used our massive dataset (millions of drivers and 100+ billion miles of driver behavior data analyzed) and our machine learning algorithms to precisely measure driver risk. Rather than using proxy variables like age, homeownership, and education to rate risk, we looked at how people actually drove, including factors like phone use, hard braking, and more. We found 8 distinct driver personas, 6 of which were interesting from a risk perspective.
Identifying the riskiest driver persona
The high-risk groups only make up 29% of all drivers, but they’re twice as likely to get into a collision as the others.
Phone Addicts, who spend over three times more time on their phones than other drivers, were in the riskiest group, and no wonder. Taking your eyes off the road for just 2 seconds increases your chance of a collision by over 20 times, and at 55 mph, is the same as driving the length of two basketball courts with your eyes closed. Since most insurance algorithms don’t measure phone use, chances are you’re paying for the Phone Addicts’ risky behavior.
Next come the Frustrated Lead-Footers, who wish they could speed but are stymied by traffic, stop signs, or other infrastructure. They have almost three times more aggressive acceleration and hard brake events than other drivers.
The last risky group is the Speed Demons, who speed nearly 6 times more than the average driver. This group spends more time than the other personas driving over 75 mph, which is unsafe even on empty stretches of road.
Insurance pricing and driver personas
The good news is that 71% of us fall into the low-risk categories: Neighborhood Navigators, Expert Commuters, and Weekend Cruisers. But with so many safe drivers, what does this mean for our insurance rates?
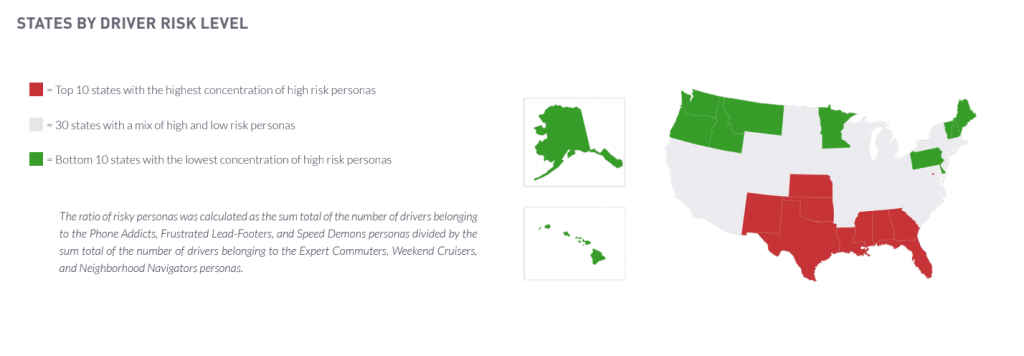

Some states come out fair. Louisiana, Texas, Washington, D.C., and Florida are the states with the riskiest drivers. They are also the most expensive for car insurance. Idaho, Maine, and Vermont have the least risky drivers, and are the least expensive.
However, some states look unfair. Delaware in particular is a low-risk state, but is among the most expensive for insurance. Delaware drivers are more likely than any others to be overcharged. Drivers in Alaska, Maryland and Rhode Island are also likely paying too much. On the flip side, states like South Dakota, New Mexico, Kansas, and Alabama have drivers that are probably not paying enough, as their driver risk is higher than their prices indicate.
The good news
The good news is that technology like Zendrive’s can make both insurance companies and insurance customers happier. Measuring driver behavior can help both sides get to prices that are much more fair. The better risk can be assessed, the more precise the models can be, and the more everyone saves.
The better news
The better news is that your driver persona isn’t permanent. Identifying risky drivers and coaching them towards better habits can improve driver behavior. This means anyone can become a safer driver. Drivers can reduce their likelihood of getting into a collision by 49%, which should particularly make parents of teens breathe easier.
The best news
The best news is that laws can help.
States with speed limits under 75 mph have far fewer people who routinely speed. Phone use laws seem to have a minimal effect on phone use so far. Data like this can help governments see where the hotspots of trouble are. Then, governments can experiment to find other mechanisms to reduce distracted driving and improve street safety. This is impossible to do well without the ability to measure the results.
Using better personas data, we can all make the streets safer. And maybe even save a little insurance money in the process!
Contact us below to learn more about Zendrive and our solutions.


Keep learning


